VMware vSphere — Why checking NUMA Configuration is so important!
If you don’t want to read through all the explanations but get a visual presentation of NUMA issues in your vSphere environment, ou can use CNIL Metrics and Logs to analyze your VMware environment.
What is NUMA
Non-uniform memory access (NUMA) is a computer memory design used in multiprocessing, where the memory access time depends on the memory location relative to the processor. Under NUMA, a processor can access its own local memory faster than non-local memory (memory local to another processor or memory shared between processors). The benefits of NUMA are limited to particular workloads, notably on servers where the data is often associated strongly with certain tasks or users.
Wikipedia — https://en.wikipedia.org/wiki/Non-uniform_memory_access
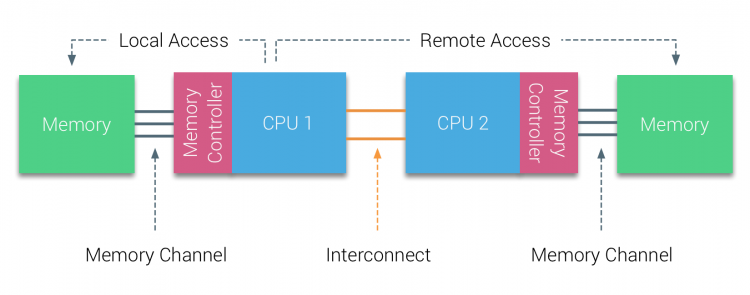
The main take away is, that the cpu — memory access is always the fastest, when the cpu can access its local memory. NUMA Nodes are CPU/Memory couples. Typically, the CPU Socket and the closest memory banks built a NUMA Node. Whenever a CPU needs to access the memory of another NUMA node, it cannot access it directly but is required to access it through the CPU owning the memory.

Example — 2 Socket machine, 12 Core CPU, 512GB RAM mostly translates to 2 NUMA nodes, each with 1 Socket, 12 Cores, 256 GB RAM.
The performance degradation not being able to access the memory through the local NUMA node can be massive and slow down the application a lot.
How does the VMware ESXi host use NUMA?
ESXi uses a sophisticated NUMA scheduler (continuously improving virtual NUMA enhancement started since vSphere 5.5) to dynamically balance processor load to optimize memory locality.
Each virtual machine managed by the NUMA scheduler is assigned a home node. A home node is one of the system’s NUMA nodes containing processors and local memory.
When memory is allocated to a virtual machine, the ESXi host always tries to allocate it from the home node. The virtual CPUs of the virtual machine are constrained to run on the home node to maximize memory locality.
The VMkernel NUMA scheduler can dynamically change a virtual machine’s home node to respond to changes in system load whenever required or possible.
Nevertheless, the VMkernel works within physical and technical boundaries, and misconfigurations can cause bad performance. You cannot just rely on the VMkernel for optimized load balancing of your VMs.
There are great articles that cover NUMA and VMware ESXi — make sure to check the Takeaways at the end of the article:
How to detect NUMA performance issues
There are many different ways to run into NUMA performance issues, but its not really simple to monitor it without 3rd party software. As we already know, the most important thing to check is the NUMA Home Node usage.
ESXTOP

When accessing the VMware ESXi console, you can use the esxtop command to check the current NUMA Home Node usage:
- esxtop
- m (the letter)
- f (to enable fields)
- G (to enable NUMA information)
Be aware, that the information is shown in real-time and does not store or show any historic data. Furthermore, it's hard to find NUMA information across multiple ESXi hosts in a cluster.
There are great articles and documents for esxtop:
CNIL Metrics and Logs
If you´re looking for a simpler solution, that stores and visualizes that information over a long period of time and for all your ESXi hosts and VMs, then you should check out Metrics and Logs. You can use the 30-day free trial to get started.

The important Metrics can be found in the Starter: VMware Virtual Machine Dashboard under Virtual Machine Memory Access Slowdown indicators

NUMA Home Node % shows the percentage of memory access that stays in the NUMA Home Node (the fastest memory access). That value should always be 100% or very close to 100%. If it goes below 90% for some time you should start optimizing.
NUMA Remote Node Access shows the memory amount in Byte that is accessed using the remote node (slowest memory access). When it comes to single-digit Mbyte amounts, don´t worry. But — Gigabytes … take action!
Just make sure to use a vCenter role for the Metrics and Logs user that allows Service Managers access.

The tricky configuration: Hot-Add CPU for large VMs
You might tend to enable Hot-Add CPU or Hot-Add Memory when configuring larger VMs, as you want the most flexibility and least downtime for them. Unfortunately, that also means that you deactivate vNUMA for these VMs — but with that comes a nasty performance degradation:
https://blogs.vmware.com/performance/2019/12/cpu-hot-add-performance-vsphere67.html
Key takeaways: VMware configuration for NUMA optimization
- Don´t enable Node interleaving in your server BIOS!
- Order or configure the physical server hardware to have equal memory amounts for each NUMA node.
- Assign less or equal amount of vCPU´s to VMs than the total number of physical cores of a single CPU Socket (stay within 1 NUMA Node). Don´t count Hyperthreading!
- Check your virtual infrastructure, in general, to work optimized with the physical NUMA node limits of your servers. Watch for Monster-VMs!
- Avoid single VM consuming more vCPUs than the single NUMA node or it might be scheduled across multiple NUMA nodes causing memory access degradation.
- Avoid single or multiple VMs consuming more RAM than a single NUMA node, because it will cause the VMkernel to span a percentage of the memory content in the remote NUMA node resulting in reduced performance.
- vNUMA (virtual NUMA) is enabled by default for VMs with 8 or more vCPUs. Caution! When enabling “hot add CPU/memory” or configuring CPU affinity, it automatically deactivates vNUMA.
- VMkernel NUMA re-balancing takes place every 2 seconds.
- vNUMA is not re-balancing! The vNUMA architecture is set, when the VM is powered on for the first time. Be aware of vMotion (DRS), when the VM is migrated to ESXi hosts with different NUMA configurations.
What can potentially cause NUMA misplacement
- Configuring VM memory limits lower than the configured memory
- Configuring more vCPUs than physical cores per CPU socket
- Configuring more memory than the NUMA node has available
To get all metrics and recommendations in the fastest way, you can use CNIL Metrics and Logs to analyse your VMware environment.
